
Q2 2025 Portfolio Commentary
The Drakkar: Our Multi Asset Class Long Short Longship Portfolio
For a refresher on how we sail our managed portfolios, click here.
Portfolio Performance
———⚜️⚜️⚜️———
The following commentary is based upon client quarterly portfolio reports and is intended as supplementary material to those reports.
———⚜️⚜️⚜️———
As a reminder, investing is just a means to an end.
That end is accomplishing your financial goals which are mapped per your custom financial plan.

Every financial plan has an implied required return (RR) that must be earned over the long term for the portfolio to do its part in making a financial plan robust.
As such, we will compare how the managed portfolios have performed relative to their respective RR.
We will also compare the managed portfolios to a comparable diversified portfolio.
Aggressive Portfolios
Relative to the Required Return (RR)
For the quarter, our managed aggressive portfolios materially outperformed their RR benchmarks.
For the year to date, our managed aggressive portfolios materially outperformed their RR benchmarks.
———⚜️⚜️⚜️———
Relative to Comparable Portfolio Benchmarks
For the quarter, our managed aggressive portfolios were in line with their aggressive portfolio benchmarks.
For the year to date, our managed aggressive portfolios materially outperformed their aggressive portfolio benchmarks.
———⚜️⚜️⚜️———
Moderate Portfolios
Relative to the Required Return (RR)
For the quarter, our managed moderate portfolios materially outperformed their RR benchmarks.
For the year to date, our managed moderate portfolios materially outperformed their RR benchmarks.
———⚜️⚜️⚜️———
Relative to Comparable Portfolio Benchmarks
For the quarter, our managed moderate portfolios materially outperformed their moderate portfolio benchmarks.
For the year to date, our managed moderate portfolios materially outperformed their moderate portfolio benchmarks.
———⚜️⚜️⚜️———
Traditional Cash Reserve Portfolios
Relative to Comparable Portfolio Benchmarks
For the quarter, our managed traditional cash reserve portfolios were in line with their cash reserve portfolio benchmarks.
For the year to date, our managed traditional cash reserve portfolios were in line with their cash reserve portfolio benchmarks.
———⚜️⚜️⚜️———
Portfolio Positioning: The Equities
Performance
For the quarter, our equity returns were materially positive and were in line with the world equity benchmark.
The primary contributors to this performance were our exposures to
Bitcoin (BTC)
Global Armament Companies (especially of the Asian and European variety)
Precious Metal Royalty/Streaming Companies
Capital Market Exchanges
———⚜️⚜️⚜️———
New Positions
Japanese Owner Operators
For our top down and longer term positive views about Japan, click here.
Regarding our investment expression of these views, we have chosen an exposure that starts with a universe of 4,000+ companies and filters out 99% of those companies. Then, the investment is allocated to approximately 30-50 companies with the following characteristics:
Authentic Japanese Exposure: Unlike common Japanese exposures which are heavily weighted towards large-cap multinationals with significant global business, this exposure targets companies with locally sourced revenues. This provides us with genuine exposure to the Japanese economy.
Alignment of Economic Interests: By focusing on owner-operators (management personnel who have significant ownership stakes in their businesses), we get exposure to management that is incentivized to maximize return on equity, return on invested capital, and shareholder returns.
Compelling Opportunities at a Bargain Price: Generally, the Japanese market is cheap relative to its developed-market peers which minimizes the risk of overpaying. This cheapness does not mean we are buying low quality. In fact, we are paying a low price to buy high quality businesses (high profits, strong balance sheets, little debt, management incentive alignment, etc) which materially improves the risk adjusted return potential.
Why is the owner operator attribute so important in Japan?
Great question!
Traditional Lifetime Employment System: This model discourages risk-taking and innovation within established companies. Thus, Japanese entrepreneurs gravitate towards an owner-operator model (management personnel are large shareholders), giving them the freedom to pursue new business ventures. As such, Japanese entrepreneurs are motivated to maximize returns for shareholders (us).
Innovation: Japan is a significant source of innovation, ranking third globally in patent filings behind China and the USA.
Foreign Competition: This is limited in Japan due to language barriers and closed corporate structures that restrict information flow.
Mature Economy: Its declining population and aging society disincentivizes global competition from entering the local Japanese market. Thus, Japanese entrepreneurs have competitive moats over their stagnant corporate peers at home and distant investors abroad when it comes to opportunistically implementing and monetizing innovative ideas and business growth plans.
For the quarter, this position outperformed the world equity benchmark. The top three contributors to this outperformance came from
Precious Metal Royalty/Streaming Companies
Let us recap why we find the royalty/streaming business model most compelling.
Buy Low ; Sell High: Royalty/Streaming companies provide upfront capital to mining companies in exchange for the right to receive a portion of future production (typically gold, silver, or other precious metals) at a fixed, discounted price or as a percentage of output.
Avoids Cost Overruns: Unlike traditional miners, royalty/streaming companies do not operate mines themselves; they earn revenue streams based on the exploration and production activities of third-party operators/miners.
Capital Light Businesses: These companies are considered "capital-light" because they avoid the significant capital expenditures, operating costs, and post-production liabilities associated with direct mining operations.
Positive Asymmetric Optionality: This structure offers "asymmetric optionality": revenues can increase both from higher metals prices and from increased production at the underlying mines, while the company itself bears minimal ongoing costs.
Inflation Protection: Precious metals generally perform well in inflationary environments, and these companies provide magnified exposure to these price movements, making them potentially inflation beneficiaries.
All-Weather Resilience: They can perform well in various economic regimes (high/low growth, high/low inflation), not just during inflationary periods.
Long-Duration Assets: Many agreements are tied to long-life mines, sometimes with decades or even centuries of production potential, providing enduring revenue streams.
Optionality and Scarcity Value: As new mine discoveries become rarer and existing high-quality assets more valuable, holding royalties/streams on these assets becomes increasingly advantageous.
Mine Diversification: Royalty/Streaming companies often hold interests in multiple mines and jurisdictions, reducing concentration risk and increasing the stability of cash flows.
In effect, this provides us with a diversified exposure to precious metals, benefiting from both price appreciation and production growth without the operational risks of mining. Additionally, these exposures typically do well when traditional exposures do not and thus provides potent equity portfolio diversification.
For the quarter, this position materially outperformed the world equity benchmark. The top contributors to this outperformance came from
Capital Markets Exchanges
Let us recap why we find the capital markets exchange business model most compelling.
We view capital market exchanges as akin to toll booth operators on economic activity without bearing the heavy risks or capital requirements faced by other market participants.
Consistent Trading Fee Generation: Exchanges, as toll booth operators, are the only consistent beneficiaries of trading activity over time. While most market participants are engaged in a zero-sum game, exchanges reliably earn fees from every transaction, regardless of market direction or participant success.
Recurring Revenue from Data Sales: Exchanges own and sell vast amounts of proprietary market data to traders, hedge funds, and media outlets. This is a high-margin, recurring, and growing revenue stream.
Asset-Light, High-Margin Business Model: Like royalty/streaming companies, exchanges operate with minimal capital requirements and have high cash operating profit margins. They are largely insulated from balance sheet vulnerabilities since they do not require significant borrowing or capital investment.
Breadth of Economic Exposure: Unlike royalty/streaming companies, which are typically tied to a single commodity or sector, exchanges benefit from a broad array of economic activities. They participate in every market large enough to require centralized, regulated trading—including equities, bonds, commodities, derivatives, and increasingly, digital assets.
Resilience and Adaptability: Many exchanges are among the oldest continuously operating businesses, having adapted to technological and regulatory changes over centuries (for example the London Stock Exchange has its roots in Jonathan’s Coffee-House circa 1698). Their business model remains robust and relevant, even as new asset classes (such as digital assets) emerge.
Beneficiaries of Volatility and Innovation: Exchanges often see increased earnings during periods of market volatility and uncertainty, as trading volumes and spreads rise. They also stand to benefit from innovations like blockchain and digital assets, which can significantly expand the universe of tradable instruments.
Limited Competition and Regulatory Moats: There are typically only a handful of regulated exchanges in each country, often due to regulatory preference for fewer, more easily supervised entities. This limited competition supports pricing power and high profitability.
With that said, we added an additional capital markets exchange that is primarily known as a global electronic stock exchange, with a strong focus on technology and growth stocks.
For the quarter, this position materially outperformed the world equity benchmark. The top contributors to this outperformance came from
———⚜️⚜️⚜️———
Exited Positions
Currency Hedged Japanese Small Companies
As the quarter progressed, we exited this position not because we were unhappy with the exposure but rather replaced it with the aforementioned exposure of Japanese owner operators which we think is a better investment expression of our positive macro views on Japan.
———⚜️⚜️⚜️———
Maintained Positions
US Large Company Equity Exposure
We held this exposure whose foundation consists of US Large Companies and then seeks to earn superior long term returns with lower downside risk by quantitatively removing overvalued low quality companies run by poor management teams. For example, these negative factors that are filtered out include:
High External Financing: companies that are over reliant on external capital through high debt or stock sales.
Wealth Destroyers: companies that reinvest but generate economic returns below their cost of capital.
Value Traps: companies where intrinsic value is lower than book value; we avoid these potential value traps.
For the quarter, this position was in line with the world equity benchmark.
Global Armaments
We held this exposure which is one that focuses on companies that make armaments for nation state security.
With the rising trend of deglobalization (in favor of the far older and more common structure of regionalization) combined with a rising trend in nation state geopolitical conflicts while considering that armaments spending has largely fallen to such lows implying that nation state conflict was over, the potential growth path forward is far more likely than not.
While our deep dive (click here for more) into the state of armaments is the foundational reason for our exposures, the White House diplomatic incident between President Trump/Vice President Vance and Ukraine’s President Zelensky served as a bottom up validation of our thesis and Mr. Market has started to come around to similar conclusions and thus is part of why European armament companies performed spectacularly well over the period.
Additionally, NATO leaders have agreed to a significant increase in defense spending, committing to allocate 5% of their Gross Domestic Product (GDP) annually to defense by 2035. This new target, announced at a recent summit in the Netherlands, more than doubles the previous goal of 2% of GDP.
In other words, it appears Europeans believe they have to be responsible for their own security and thus will attempt to rearm by growing their own industrial base and armament base at the expense of buying from American armament firms.

For the quarter, this position materially outperformed the world equity benchmark. The top three contributors to this outperformance came from
Palantir (US Armament Tech)
Hanwha Aerospace (South Korean Armaments)
Rheinmetall AG (German Armaments)
West Texas Real Estate
We held our exposures to West Texas Real Estate which is specifically in the highly energy productive Permian Basin where we own the real estate as well as the oil, gas, and water rights.
Let us recap why we find these real estate exposures most compelling.
Exposure 1
Vast, Perpetual Land Holdings: It is one of the largest private landowners in Texas, with approximately 870,000 acres of surface estate and 2.4 million acres of mineral interests, primarily in the Permian Basin. Additionally, this exposure is located in District 8 which is responsible for about 20% of all oil and gas production in the U.S. This land is a finite, irreplaceable asset that cannot be replicated.
High-Margin Royalty Income: It owns perpetual oil and gas royalty interests on hundreds of thousands of acres. This generates high-margin revenue from energy production without the associated capital expenditures or operating risks of exploration and production companies.
Capital-Light Compounding Machine: The business model requires minimal capital investment to generate revenue, leading to extremely high free cash flow. This cash can be used for dividends, share buybacks, and acquiring more royalty assets, creating a powerful compounding effect over time.
Zero Debt: It has a pristine balance sheet with no debt, making it incredibly resilient through all economic cycles.
Multi-Faceted Revenue Streams: Beyond oil and gas, it generates revenue from surface leases, easements for pipelines, water sales, and other commercial activities, providing diverse and growing income streams.
Exposure 2
Modern, Focused Asset Base: It controls approximately 220,000 surface acres and 8,000 gross mineral acres in and around the Delaware Basin, a highly active sub-basin of the Permian. Its holdings are strategically located to service modern energy development.
Explicit Focus on New Infrastructure: It was structured from the start to capitalize on the infrastructure needs of the 21st century. It has an explicit strategy of leasing its land for data centers, bitcoin mining facilities, and other large-scale industrial projects by offering unique advantages for them such as abundant and cheap natural gas for power generation, extensive water resources for cooling, an unregulated power grid, and low existing populations so there is little to no competition between citizens and business for access to said resources.
Strategic Water Business: A core part of its strategy is its water business, including providing produced water management (e.g., saltwater disposal) and developing water infrastructure, which are critical services for energy producers in the region.
Despite these two separate exposures, they have the following in common.
Hard Asset Focus: Both are pure-play land and resource companies. Their value is tied directly to tangible, finite assets rather than intellectual property or manufacturing processes.
Inflation Beneficiaries: Their revenues from royalties and leases are intrinsically linked to commodity prices and economic activity, making them excellent hedges against monetary inflation.
Capital-Light Business Model: Both primarily lease their assets to others and collect high-margin fees and royalties, avoiding the heavy capital costs and operational risks of their tenants (e.g., oil drillers, data center operators, bitcoin miners, etc).
Permian Basin Location: Both are strategically centered in the Permian Basin, the most prolific and economically viable oil and gas producing region in North America.
For the quarter, these exposures materially underperformed the world equity benchmark. The top contributors to this underperformance came from
Digital Assets: Bitcoin
Yes we are aware Bitcoin (BTC) is not an equity but we assign it to the risk sleeve for risk management and portfolio management reasons.
We find the following characteristics of BTC very intriguing.
For a deeper dive into this topic, click here.
Scarcity: The fixed supply of 21 million coins provides a hard cap, unlike fiat currencies that can be inflated by commercial and central banks.
Decentralization: No single entity controls the BTC network, making it resistant to censorship and single points of failure.
Immutability: The blockchain's design makes it extremely difficult to alter past transactions, providing a secure and auditable record.
Portability: BTC can be easily transferred globally over the internet and can be self-custodied in a portable manner.
Censorship Resistance: Transactions cannot be easily blocked by governments or financial institutions.
Increasing Adoption: As more individuals, businesses, and even institutions adopt BTC, its network effects strengthen, and its utility as both a store of value and a medium of exchange grows.
These characteristics are especially attractive in the context of a world reversing from globalization back to regionalization with growing distrust between multiple layers of society (nations, central banks, governments, citizens, etc). Moreover, it provides a potential safe harbor for one’s purchasing power since monetary debasement is often the result when governments aim to restructure society but want to avoid the short term pain required and thus succumb to the temptation to create more money.
For the quarter, this position materially outperformed the world equity benchmark.
A Capital Markets Exchange
We maintained an exposure to a leading capital markets exchange.
Since we have already covered why we find exchanges generally compelling, let us summarize specifics about this exposure.
Proprietary, High-Demand Products: Unlike other exchanges that just trade other companies' stocks, it owns unique, indispensable products that it created. Key examples include:
The VIX: This index is the globally recognized standard for equity market volatility. It has a monopoly on VIX options and futures, which are essential for hedging.
SPX Options: It has exclusive rights to options on the S&P 500 index, the most important benchmark for the U.S. stock market.
Leader in Secular Growth Trends: It is at the center of the explosive growth in index options and derivatives used for sophisticated hedging and income-generating strategies, including the recent rise of Zero-Days-to-Expiration (0DTE) options.
Pricing Power: Because it owns these exclusive, must-have products, it has significant power to set the fees for trading them, protecting its high margins.
For the quarter, this position materially undeperformed the world equity benchmark. The top contributors to this undeperformance came from
A Defense and Aerospace Component Manufacturer
We maintained an exposure to a prominent global player in the military and commercial aerospace sector, specializing in the design, production, and supply of highly engineered aircraft components.
Let us summarize specifics about this exposure.
Private Equity Model in Public Markets: Its strategy mirrors that of a private equity firm. They acquire aerospace businesses with strong, defensible market positions and proprietary products. This allows us to access a private equity-like return profile with the liquidity of a publicly-traded stock.
Focus on High-Margin Aftermarket: A significant portion of its business comes from the aerospace aftermarket. These are highly engineered, proprietary components where it is often the sole-source supplier thus creating substantial barriers for competitors seeking to enter the market. Moreover, these proprietary parts have high-profit margins and are required for the life of an aircraft, providing a long-term, recurring revenue stream.
Disciplined and Value-Creating Capital Allocation: The management team is known for its disciplined approach to acquiring businesses and returning capital to shareholders.
Durable Competitive Advantages: Through its portfolio of companies, it has strong competitive moats. These include Federal Aviation Administration (FAA) certifications, intellectual property, and established relationships with aircraft manufacturers, which create high barriers to entry for competitors.
For the quarter, this position marginally underperformed the world equity benchmark.
The top contributors to this underperformance came from
A Multinational Military Technology and Armaments Manufacturer
We maintained an exposure to one of the world’s largest military technology and armament manufacturers.
Let us summarize the specifics about the exposure.
Leading Armament Manufacturer: It is a primary contractor for the U.S. government with major long-term projects that ensure a steady revenue stream. Key programs include the B-2 Spirit Stealth Bomber, the B-21 Raider Stealth Bomber, the Sentinel intercontinental ballistic missile system, and numerous drone/unmanned systems. This entrenched position in a highly relevant section of the armament industry (Iran recently felt the tip of the spear on these programs) provides a significant competitive advantage.
Exposure to High-Growth Sectors: It is heavily invested in rapidly growing areas of the armament markets. This includes a strong presence in space technology, cybersecurity, and autonomous systems. Recent news highlights a successful test of the powerful new BOLE solid rocket booster for NASA's Artemis missions and a strategic investment in Firefly Aerospace (it achieved the first successful commercial Moon landing ever) to develop new launch vehicles.
Innovation and Technological Advancement: It is at the forefront of developing next-generation defense technologies. Their work on stealth aircraft, hypersonic weapons, and advanced missile defense systems positions them to capitalize on future modernizations of the U.S. military and its allies.
Solid Financials: The company exhibits strong financial health, with a solid balance sheet and consistent cash flow generation. This financial stability allows for continued investment in research and development, strategic acquisitions, and shareholder-friendly actions.
Favorable Geopolitical Environment: Increased global instability and a renewed focus on national security by the U.S. and its allies are likely to lead to sustained or increased defense spending especially in the light of our deep dive into this topic.
For the quarter, this position materially underperformed the world equity benchmark. The top contributors to this underperformance came from
A Payment Processing Company
We maintained an exposure to one of the world’s largest payment processing companies.
Let us summarize the specifics about the exposure.
Inflation Beneficiary Revenue Model: Its revenues are based on a percentage of Gross Dollar Volume (GDV), making it a natural and direct beneficiary of long-term inflation and monetary debasement. As prices rise, its revenue rises organically without requiring additional capital investment.
"Toll Road" on Global Commerce: It operates an essential, non-discretionary infrastructure for global payments. Like a toll road or a securities exchange, it collects a small fee on a massive and growing volume of transactions, making it a "winner-indifferent" participant in economic growth that profits from activity itself.
Capital-Light Compounding Machine: It is exceptionally asset-light, requiring minimal capital reinvestment to maintain or grow. This results in extremely high operating margins and prodigious free cash flow, which can be returned to shareholders, fitting an enviable ideal of a business that compounds capital efficiently.
Durable Moat via Network Effects: It is not a company at a material risk of displacement. Rather, it is a durable infrastructure business whose powerful, two-sided network effect creates an almost insurmountable competitive moat, aligning with our preference for businesses with long product lifecycles and high barriers to entry.
Strategic Position in the Future of Payments: It serves as a strategic bet on the persistence of the current payment system while also being positioned to act as a bridge to a future that may include digital assets transacting over its established rails.
For the quarter, this position materially underperformed the world equity benchmark. The top contributors to this underperformance came from:
———⚜️⚜️⚜️———
Portfolio Positioning: The Alternatives
Performance
Our alternative positions were significantly positive for the quarter while world equities were materially positive and broad bonds were essentially flat.
As a reminder, the alternatives are designed to generate returns that are low to negatively correlated to both equities and bonds. For this quarter, they did exactly what they were supposed to do.
New Positions
None
Exited Positions
None
Maintained Positions
Managed Futures
As a reminder, being “long” means you make money when prices rise and conversely being “short” means you make money when prices fall.
These strategies go long what is trending up and go short what is trending down using a quantitative multi model framework i.e. price, volume, volatility, etc.
The trends that can be harnessed include all the major asset classes of equities, bonds, commodities, and currencies.
Moreover, it was these strategies that materially protected our capital in 2022 when virtually every long only vanilla stock and bond investors got crushed.
The beauty of this investment style is the ruthless execution of its quantitive rules which means there is no psychological barriers to changing one’s mind and thus positions when the data says the world is changing.
In fact, the long term evidence of this strategy’s veracity is the human tendency to under-react to long term real world fundamental change (we tend to assume the recent past will continue into the future).
As of this writing, our updated positions are:
Long
Commodities: Lean Hogs, Cattle Feeder, Live Cattle, West Texas Crude Oil, Copper, Silver, Cocoa, Palladium, Gasoline, Wheat, Platinum, Soybeans, Soybean Oil, NY Harbor Heating Oil, Corn, and Canola.
Bonds: Canadian 5 Year Treasuries, Canadian 10 Year Treasuries, 3 Month CORRA, and Canadian 2 Year Treasuries.
Currencies: None
Equities: None
Short
Commodities: Natural Gas, Coffee, Sugar, Cotton, and Soybean Meal.
Bonds: US 2 Year Treasuries, US 10 Year Treasuries, US 5 Year Treasuries, US 20 Year Treasuries, US 30 Year Treasuries, and 3 Month SOFR.
Currencies: None
Equities: None
Furthermore, there is asymmetric value in these types of strategies in the context of an ultra low starting point of armament spending which leads to failed deterrence which leads to kinetic conflict which leads to a resurgence in armament spending as we discuss here.
For the quarter, this position materially underperformed both world equity and broad bond benchmarks.
This underperformance can be attributed to
Whipsawing Markets: The second quarter was defined by sharp and rapid price reversals across various asset classes. These "whipsaw" conditions are detrimental to trend-following strategies, which enter positions expecting a directional move to continue, only to have the market swiftly move against them, leading to losses.
Breakdown of Correlations: The typical relationships between different asset classes, such as stocks, bonds, and commodities, became unreliable. These models often depend on these historical correlations for risk management and diversification. When these relationships faltered, it undermined the effectiveness of the trading strategies.
Fleeting and Unstable Trends: While some trends did emerge, they were often short-lived and lacked the sustained momentum that trend-following strategies require to be profitable. This lack of persistent direction meant funds struggled to capture meaningful gains and were often caught on the wrong side of quick market turnarounds. The rapid and widespread nature of the reversals created a hostile environment for most systematic trading models.
Gold Bullion
As a reminder, our gold exposure (which we helped get created) is the combination of two different strategies:
First, we get 1.5X exposure to the price of gold. For example, if the gold price goes up 10% then this exposure would likely be up 15%. Effectively, it buys $10 of gold with cash and then borrows the remaining $5 to buy the remaining gold position which results in a total exposure of $15. By borrowing funds as institutional investors in global capital markets, we are able to borrow at an interest rate in the low single digits. We are effectively borrowing a debasing fiat currency in the low single digits to buy a debasement resistant monetary reserve asset.
Second, we layer on the selling of put spreads to generate option income. This is akin to selling a fire insurance policy that lasts for 2 weeks before it expires for a price of $10 and then buying firestorm reinsurance for $1 thus pocketing $9 for the two week period. By renewing this “fire insurance policy” every two weeks we expect over the long term to generate a modest amount of additional income in a very prudent manner.
When these positions are combined we have effectively created a gold exposure that generates income which is boosted by borrowing a modest amount of rapidly debasing fiat currency to buy a debasement resistant monetary reserve asset.
Using our applied history framework, which we see as a practical tool that uses the laboratory of the past to better understand and navigate the complexities of the present and future, we observed that Gresham’s Law states “bad money drives out good money” i.e. people rapidly spend the less valuable money and hoard the most valuable money.
For example, you might spend fiat paper currency for food and then hoard your gold bullion.
We then molded that historical observation into an investment expression that is borrowing “bad money” to buy more of the “good money”.
Finally, at the 50,000 ft altitude of analysis, you will see that
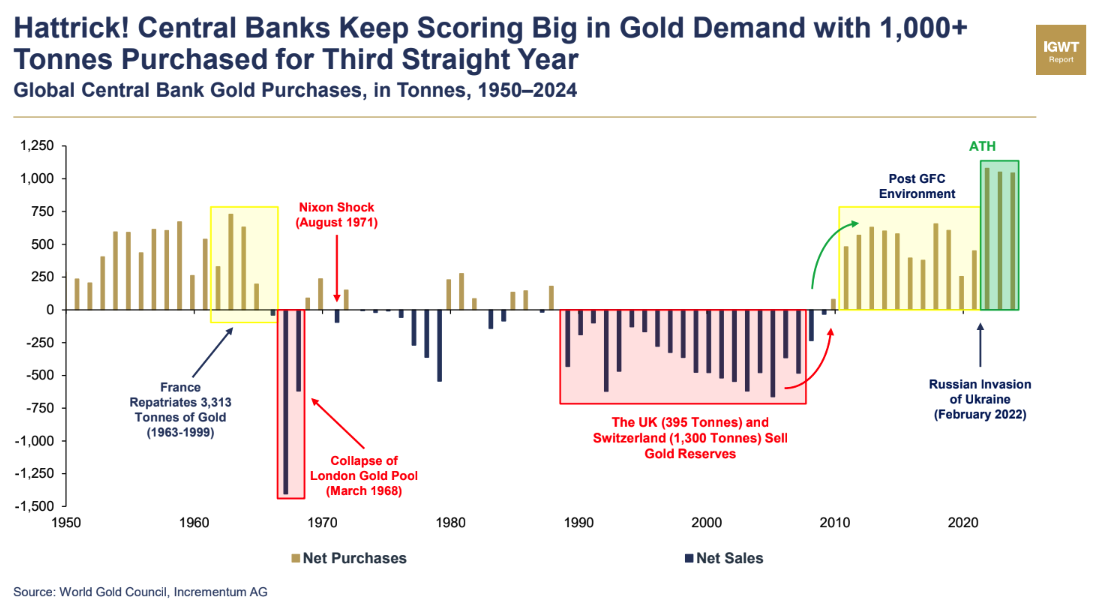
Gold demand from global central banks is accelerating at the same time US Treasuries are being reduced.
Gold demand from global central banks intensely accelerated after the start of Russia’s invasion of Ukraine.
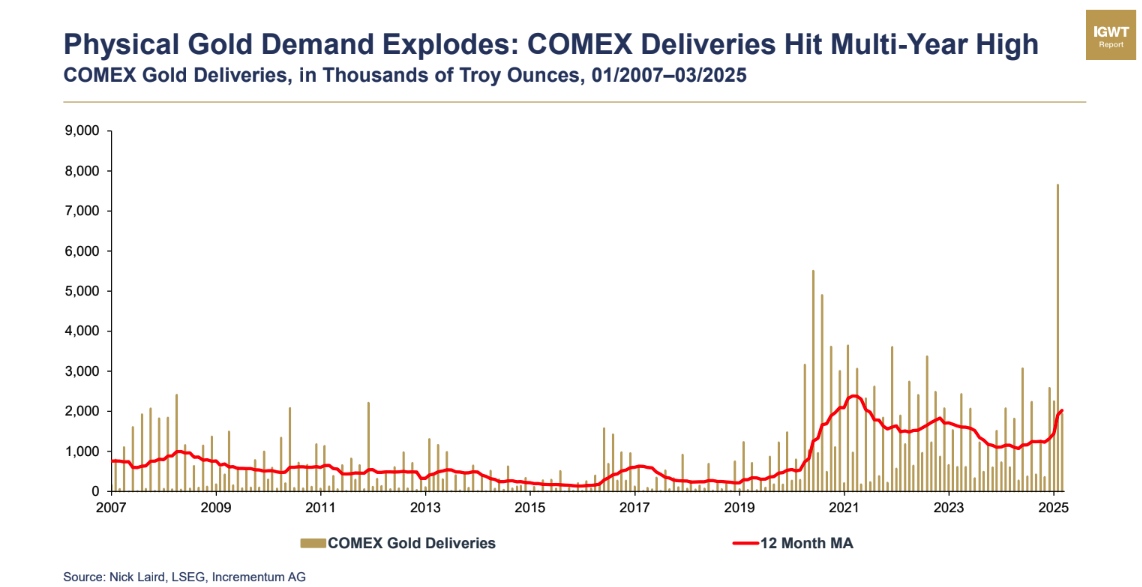
Gold exposure is being specifically expressed via physical deliveries which highlights growing mistrust.
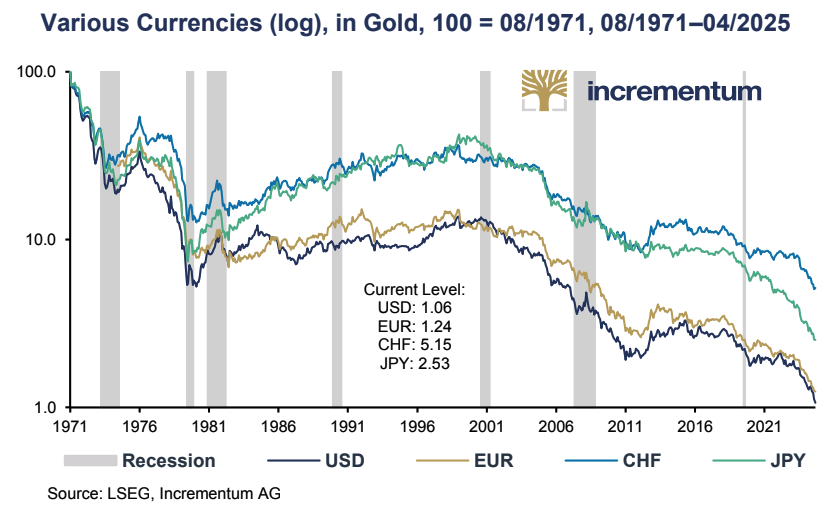
The top global fiat currencies (USD, EUR, GBP, CHF, JPY, etc) have all lost material value relative to gold over the past several decades with the best performing fiat of the Swiss Franc (CHF) “only” losing 93% of its value.
Over the past 109 years, the gold supply has increased from 38,387 tones in 1914 to 212,582 tonnes in 2023 which is an annualized increase of 1.59% per year which favorably compares to the USD supply of 26 billion in 1914 to 212,582 billion in 2023 which is an annualized increase of 8.61%.

Source: World Gold Council, Incrementum AG, Reuters Eikon, USGS, Federal Reserve St Louis
For a deeper dive into the topic of gold, click here.
For the quarter, our returns in our gold positions significantly outperformed while the world equity benchmark was materially positive and broad bonds were essentially flat.
The information in this document is provided in good faith without any warranty and is intended for the recipient’s background information only. It does not constitute investment advice, recommendation, or an offer of any services or products for sale and is not intended to provide a sufficient basis on which to make an investment decision. It is the responsibility of any persons wishing to make a purchase to inform themselves of and observe all applicable laws and regulations.